ich würde mir gerne die DayAhead-Preise der Entso-E in der UI anzeigen lassen und hänge leider gerade ein bisschen.
Ich habe schon meinen eigenen API Token für Entso-E generiert und die Verbindung sollte auch passen. Die Preise sind auf der Edge-Seite vorhanden. Hier lasse ich mir die Preise in “TouEntsoeImpl.java” ausgeben:
Hast Du schon einen entsprechenden Controller für ToU eingerichtet? m.W. erscheinen die Werte nur, wenn ein Controller eingerichtet und aktiviert wurde.
Letzteres finde ich nicht sehr praktisch. Ich (persönlich) fände es auch besser wenn die Werte immer im UI angezeigt würden. Allein um mal ein Gespür für die Preisentwicklung zu bekommen.
Ich habe für mich mal einen Vergleich zwischen meinem Anbieter und Tibber in Abhängigkeit vom Verbrauch in Grafana gemacht und bin zu dem Schluss gekommen, dass sich ein variabler Tarif für mich nicht lohnt.
Als Vorlage/Idee diente mir diese Seite.
danke für deine Antwort.
Genau, mit dem timeofusetariff controller klappt`s schon und mir werden die Preise in der UI angezeigt. Aber genau wie du möchte ich die Preise alleine (ohne Controller) sehen.
Und hierfür versuche ich gerade zu verstehen, wie die Daten zur UI übertragen werden, um mir dann evtl. ein eigenes Widget für die Preisen zu erstellen.
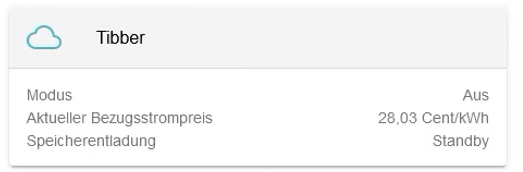
Das Widget von Tibber hier habe ich bei Stefan auf Youtube gesehen:
Dann habe ich Dich wohl nicht recht verstanden.
Die Anzeige der Preise im UI gab es. Mit dem entsprechenden Controller. Es reichte, wenn der Controller auf Standby war. Ist…puh…2 Monate her. Dann gab´s ein Update und die Werte werden nur angezeigt wenn der Controller aktiv ist.
Mehr kann ich Dir leider auch nicht sagen. Vielleicht meldet sich ja noch ein Contributor zu Wort.
Prices become visible only when the controller is enabled; unfortunately, this functionality is not possible without the controller.
To dispel any confusion, it’s important to note that the retrieval of prices from the API is a service independent of the controller. The controller itself is a standalone component. The widget you see in the UI belongs to the controller, not the price provider. The controller retrieves the prices and stores it in a channel within the controller, and this data is communicated through the UI. Regrettably, the price from the API is not stored elsewhere, necessitating the activation of the controller.
The term ‘standby’ referred to the controller’s state, indicating that the controller was still active but not prompting the storage system to take action. However, with a recent significant update to the controller implementation, we’ve overhauled the entire architecture, and the ‘standby’ state no longer exists. It’s crucial to note that while this change has occurred, it does not impact anything related to the problem you mentioned. The controller still needs to be active for prices to be visible on the UI widget.
In summary, you can still view prices on the UI widget, but the controller must be active.
thank you for your reply! I understand that I need to activate the controller.
I have two more questions:
Is it possible to display two different prices at the same time as well? (E.g. use one controller to transfer both prices or use two controllers and put these in one module on the UI side)
Is it also possible to also transfer all 96 quarterly prices to create a module that shows all these prices in the modular unit for example?
Is it possible to display two different prices at the same time as well? (E.g. use one controller to transfer both prices or use two controllers and put these in one module on the UI side)
we are currently limited to activating a single time-of-use tariff provider. This implies that two different prices at the same time is not feasible.
Is it also possible to also transfer all 96 quarterly prices to create a module that shows all these prices in the modular unit for example?
Absolutely, this functionality is already in place. along with transferring the quarterly prices, the system also seamlessly transmits anticipated states derived from the controller to the user interface. Current implementation is such a way that, it sends the last three hour data (prices, states) and next future 21 hour data (prices, states). This information visible in the modal component is only visible for the admin users.
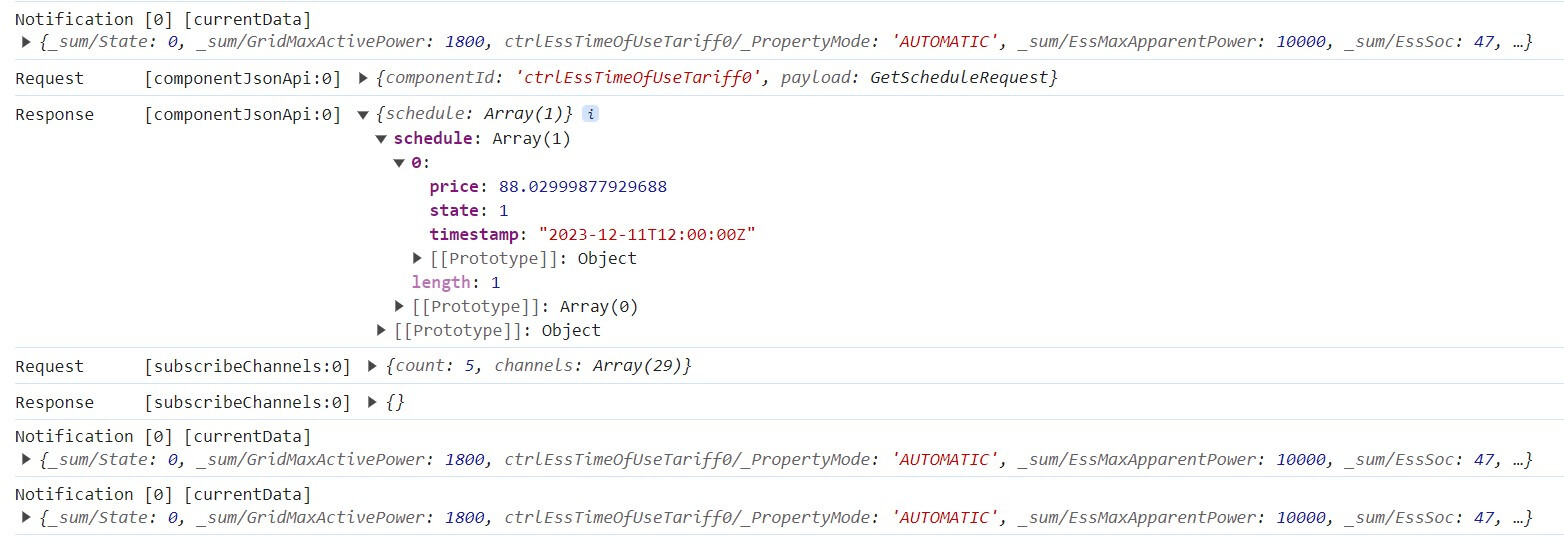
It is implemented in the jsonrpc request handler:
function is triggered when we click the flat widget during opening of modal component
thank you once again!
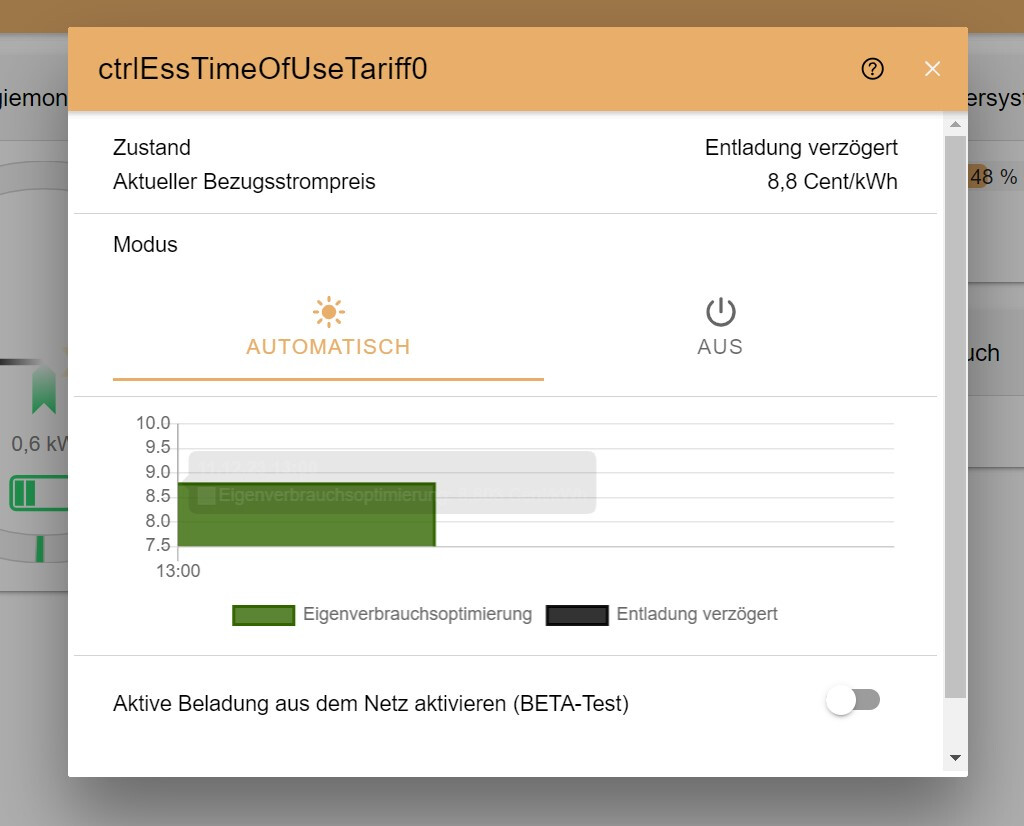
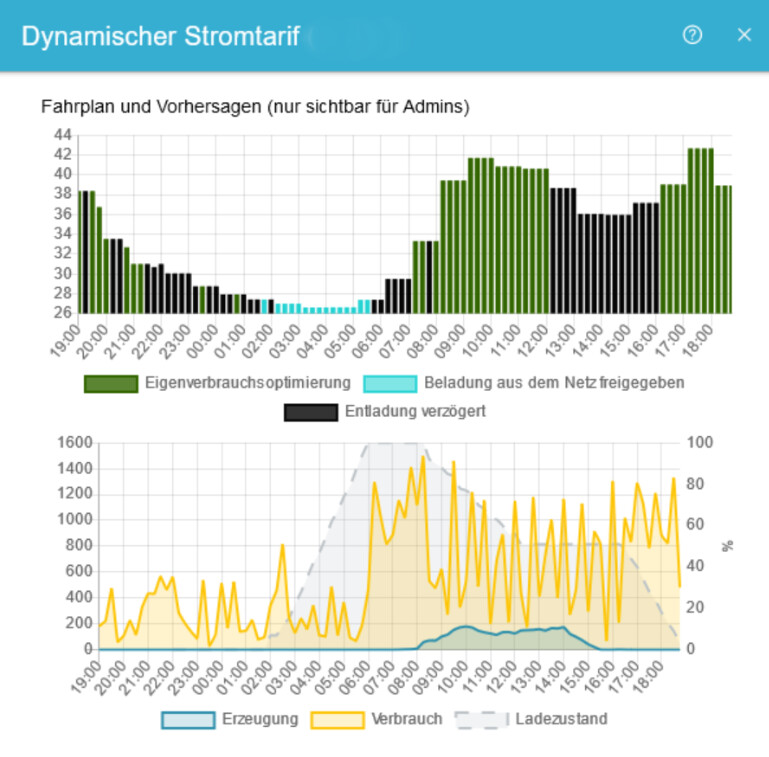
After pulling the recent changes (from main branch), setting up the InfluxDB and logging in as admin I tried out the modal component of the TOU controller. It looks like this for me:
Now, I wonder how I can access and see the 96 prices (last three hour data and next future 21 hour data). Inspecting the traffic in my browser I can see that when clicking on the flat component to trigger the modal component there is only one price as it is for the flat component (currentData):
The modal typically presents a 24-hour dataset (96 values), encompassing the past 3 hours (12 values) and the subsequent 21 hours (84 values). However, it appears that the historical values for the past hours are absent in the screenshot, possibly due to a lack of data stored in the database for those specific channels.
Regarding the future 21-hour data, you have to wait for sometime because the controller employs jenetics for simulation and schedule generation, which can take some time. In my experience, I usually wait for approximately 3-5 minutes for this process to complete.
We (mainly me and Sagar) are continuously working on features areound time-of-use, so there have been a lot of improvements recently. The screenshot here shows a (nearly up-to-date) UI for the planned schedule, including the future prices: Mehr Freiheit in der Nutzung dynamischer Stromtarife – OpenEMS
Thank you @stefan.feilmeier this looks nice!
I pulled the new code and using my Entsoe api key works fine for me. Let’s say I want to simulate different components over one month.
Is it possible to use CSV files for the prices instead of letting the simulation run for so long?
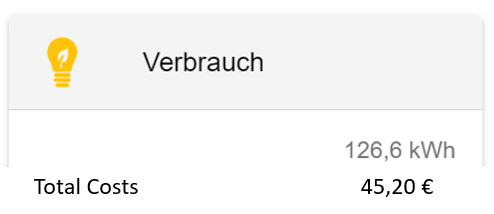
Is it possible to accumulate the total costs in the history? I would imagine it like this:
Or do you think it is better to include this in the history component of the TOU controller?
To simulate a Time-of-Use price provider you would need a Simulated.Timeofusetariff component - that’s something we did not implement yet, but should be doable, taking the existing Simulators and Datasources as example.
Of course it’s possible to accumulate the costs. A proper place might be in the ToU-Controller or in “_sum”. Be aware that it will be difficult to calculate the cost of the Consumption, because then you need to find a price-tag also for consumed energy from PV and ESS discharge. I’d rather show the sumed-up price for the “Buy-from-Grid” energy in the “Grid” widget.
Just as a note: we are not yet showing actual price information in our serial products, because the energy and price we measure will always slightly deviate from the actually invoiced price. If we implemented this feature it would surely require a clear disclaimer written by a lawyer.
alright, thank you!
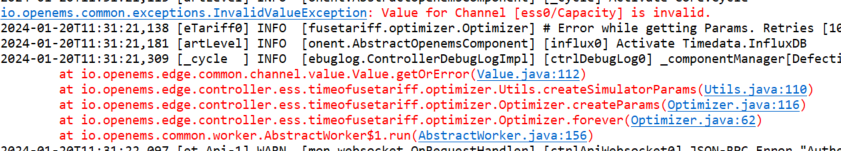
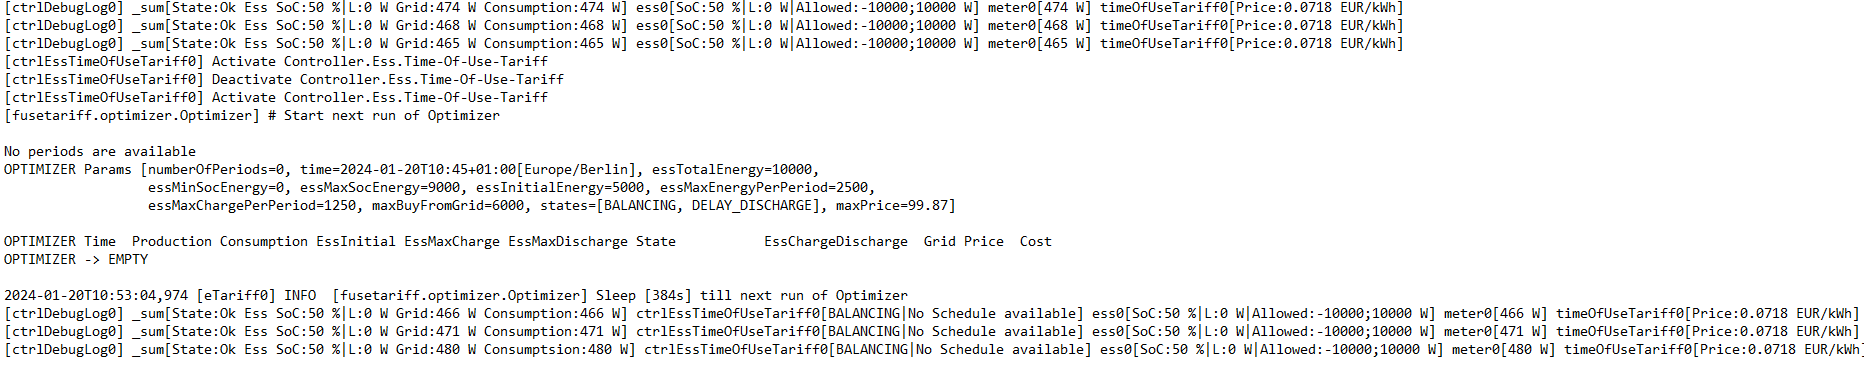
I have a hard time debugging why the controller cannot calculate the schedule even though it is running more than 15 minutes. Apparently, the periods in the Optimizer are constantly null. Currently my logs look like this:
Could it be, that you receive an Exception anywhere else in the log. E.g. a common problem is, that there is no prediction available, or the ESS has no Capacity set, etc.
As I said, I did not test simulation till now, so cannot guide you completely to a working solution.
The screenshot shows numberOfPeriods=0. The log is generated here and the value is calculated here:
var numberOfPeriods = min(this.productions.length, min(this.consumptions.length, this.prices.length));
Prices seem to be fine, but I believe you do not have a prediction for Production and Consumption available, so those arrays are empty. There is no Simulator component for a Predictor available, but you could setup a Persistence-Model-Predictor and a RRD4j Timedata Provider and let the system run for a few hours. Then you should receive a prediction. Alternatively you could mock the data statically here for now.