Why was “Bitcoin Miners with Braiins OS” added to OpenEMS and what is the purpose of this new component?
This new Bundle allows connection to Bitcoin Miners that run the Braiins OS operating system. This way OpenEMS
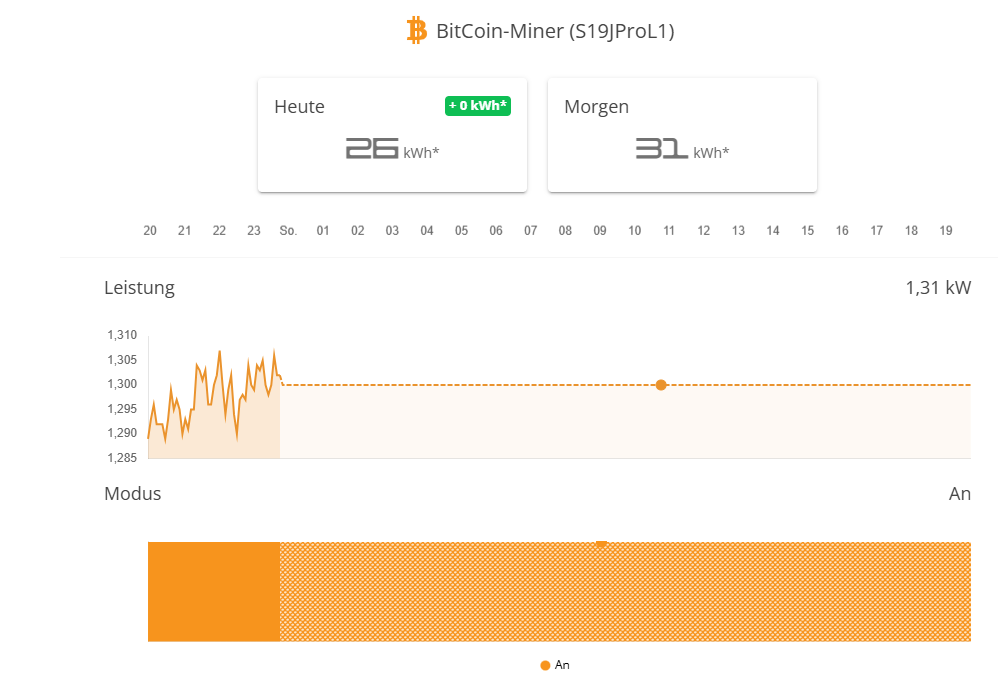
- can control - pause/resume - bitcoin mining via direct API calls
- can handle a time schedule when bitcoin mining should be active
- can read the power consumption and visualize it in Live and History
- can - given a time schedule is existing - plan the future power consumption from bitcoin mining
See this screenshot:
We also plan to release this as a free (DIY) FEMS App for FENECON customers.
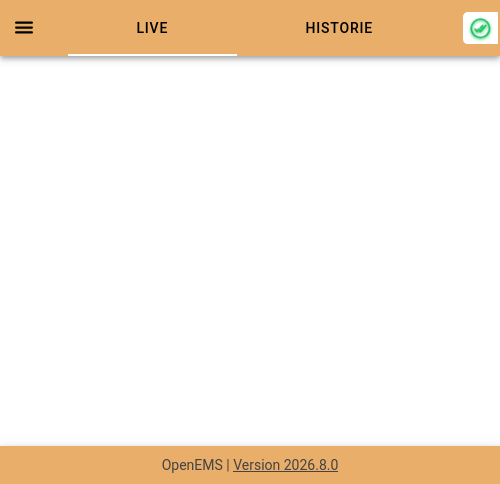
After having updated to 2026.8.0 (using the current/old UI) we’re encountering the issue that the content area of the live view stays empty:
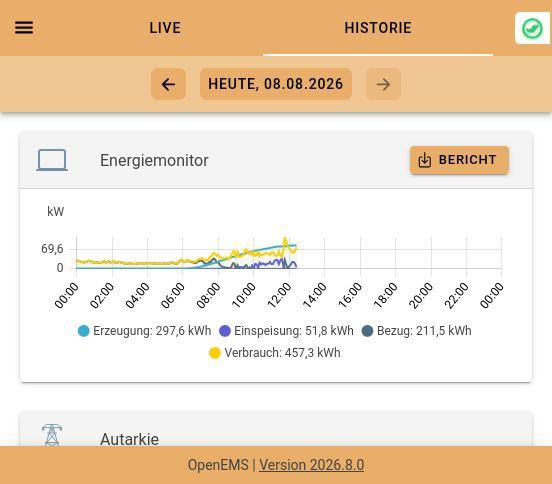
The history view works fine:
For other parts, e.g., configure components or log view the content area also stays empty and only displays content after you have clicked in the search field once and then in the content area again.
We’re running OpenEMS edge + UI behind a reverse proxy (ngninx). The problem persists with different computers and web browsers. The browser developer tools web console in Firefox shows only some of following errors and otherwise just get with http/2 200 result:
Source-Map-Fehler: No sources are declared in this source map.
Ressourcen-Adresse: https://example.com/chunk-2HK25VJH.js
Source-Map-Adresse: chunk-2HK25VJH.js.map
Any idea what the issue could be, or how to debug this?
I have the same problem. Switching fast between History and Live sometimes resolves it and Live works after that normally.
I tried to find the issue, but only got that far: it looks like subscriptions in the edgeRpc UI are missing/failing - currentData only has _sum/State and not all the other ones.
Also some “detail pages” in the history only show a blank (empty, white) page for me, e.g.,
https://example.com/device/0/history/gridchart
https://example.com/device/0/history/productionchart
https://example.com/device/0/history/digitaloutputchart
https://example.com/device/0/history/consumptionchart
The source code (of one example) is:
<!DOCTYPE html>
<html lang="en" class="notranslate">

<head>
  <meta charset="utf-8"/>
  <meta http-equiv="X-UA-Compatible" content="IE=edge"/>
  <base href="/"/>
  <meta name="viewport" content="viewport-fit=cover, width=device-width, initial-scale=1.0, minimum-scale=1.0, maximum-scale=1.0, user-scalable=no"/>
  <meta name="format-detection" content="telephone=no"/>

  <!-- Workaround -> has to be removed, icons should be already included in materials -->
  <link href="https://fonts.googleapis.com/icon?family=Material+Icons" rel="stylesheet"/>

  <!-- favicon; generated using https://realfavicongenerator.net -->
  <link rel="apple-touch-icon" sizes="180x180" href="apple-touch-icon.png">
  <link rel="icon" type="image/png" sizes="32x32" href="favicon-32x32.png">
  <link rel="icon" type="image/png" sizes="16x16" href="favicon-16x16.png">
  <link rel="manifest" href="site.webmanifest">
  <link rel="mask-icon" href="safari-pinned-tab.svg" color="#f4a942">
  <meta name="msapplication-TileColor" content="#f4a942">
  <meta name="theme-color" content="#f4a942">
  <script type="text/javascript" src="theme-loader.js" defer=""></script>
<link rel="stylesheet" href="styles.css"></head>

<body>
  <app-root></app-root>
  <noscript>Please enable JavaScript to continue using this application.</noscript>
<link rel="modulepreload" href="chunk-VP6ZT7SY.js"><link rel="modulepreload" href="chunk-MBMQZEST.js"><link rel="modulepreload" href="chunk-FVSQWLPJ.js"><link rel="modulepreload" href="chunk-QMIOFL7S.js"><link rel="modulepreload" href="chunk-XQAGPSDN.js"><link rel="modulepreload" href="chunk-QPB3BJD4.js"><link rel="modulepreload" href="chunk-VW4RYTEG.js"><link rel="modulepreload" href="chunk-DVJAVNJ2.js"><link rel="modulepreload" href="chunk-BLJOTWRJ.js"><link rel="modulepreload" href="chunk-EVRNUXGA.js"><script src="polyfills.js" type="module"></script><script src="main.js" type="module"></script></body>

</html>
The pages autarchychart and selfconsumptionchart are displayed correct.
I’m having the same issue with current develop (2026.9). Quickly switching between live & history also brings live up, but history detail charts stay blank for me.
Opening the web UI directly, without going through a reverse proxy, does not change anything. @chpo are you also using the docker build, or are you running a native debian/systemd installation?
I’m using a self build docker image in a nginx reverse proxy setup. But there is nothing special in the configuration - just two docker containers (edge and nginx). It has been running for month without this problem.
@da-Kai as you are providing the official docker containers and do know about the details of OpenEMS, do you have an idea if using docker may have an influence here and how to debug further?
We had a similar issue recently with our builds, because the build configuration was missing the “prod” argument. I am not too familiar with the Docker builds, but it looks like this could be the issue here as well:
Dockerfile.edge defines
ARG VERSION="openems,openems-edge-docker"
and builds with
node_modules/.bin/ng build -c "$VERSION";
Can you please test with the first line changed to:
ARG VERSION="openems,openems-edge-docker,prod"
Same applies to Dockerfile.backend.
I change it to
ng build -c "openems,openems-edge-prod,prod"
and the UI works again. Thanks for the heads-up.
I fixed it upstream:
Thx for your support! Happy to have it in 2026.9. 
Debugging since days why my new UI widget is not working, I was just up to creating an issue with the switch to the newer Angular version before I luckily saw your backport commit and tried again which lead me here  I can confirm that the addition of “prod” fixes the issue.
For future readers: Watch out because DockerHub image 2026.8.0 contains the bug as well.