I am trying to store the simulation results using InfluxDB In order to obtain the UI history. So I did the following:
I followed the simulation steps according to “Getting Started guide” Link
I run InfluxDB on my machine using PowerShell
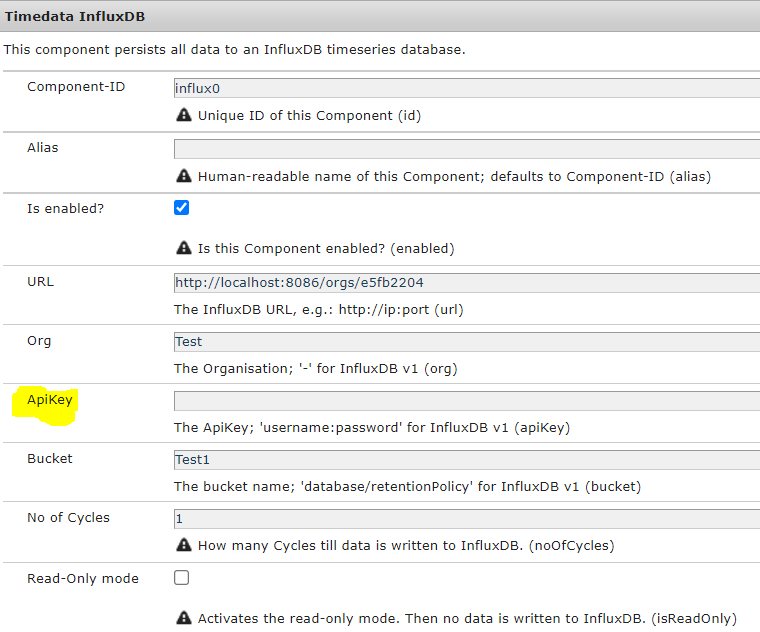
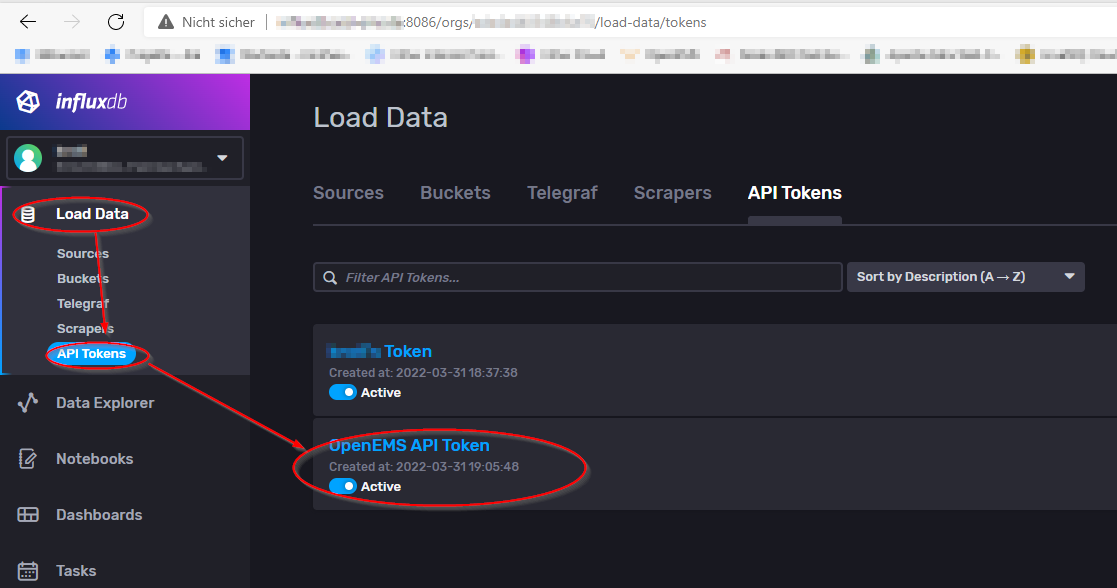
Then I configured Time data InfluxDB and I filled the required filed [I’m not sure about the API key, is it the same API token] ?, then I stucked !, what are the steps to collect the simulation data, store it in influxDB then getting the UI historical data ?
yes - data will be automatically stored in your influxdb when the component is active. I assume your “simulation data” is created by a “Simulator *****” Component. This data will aswell be stored in the influxdb.
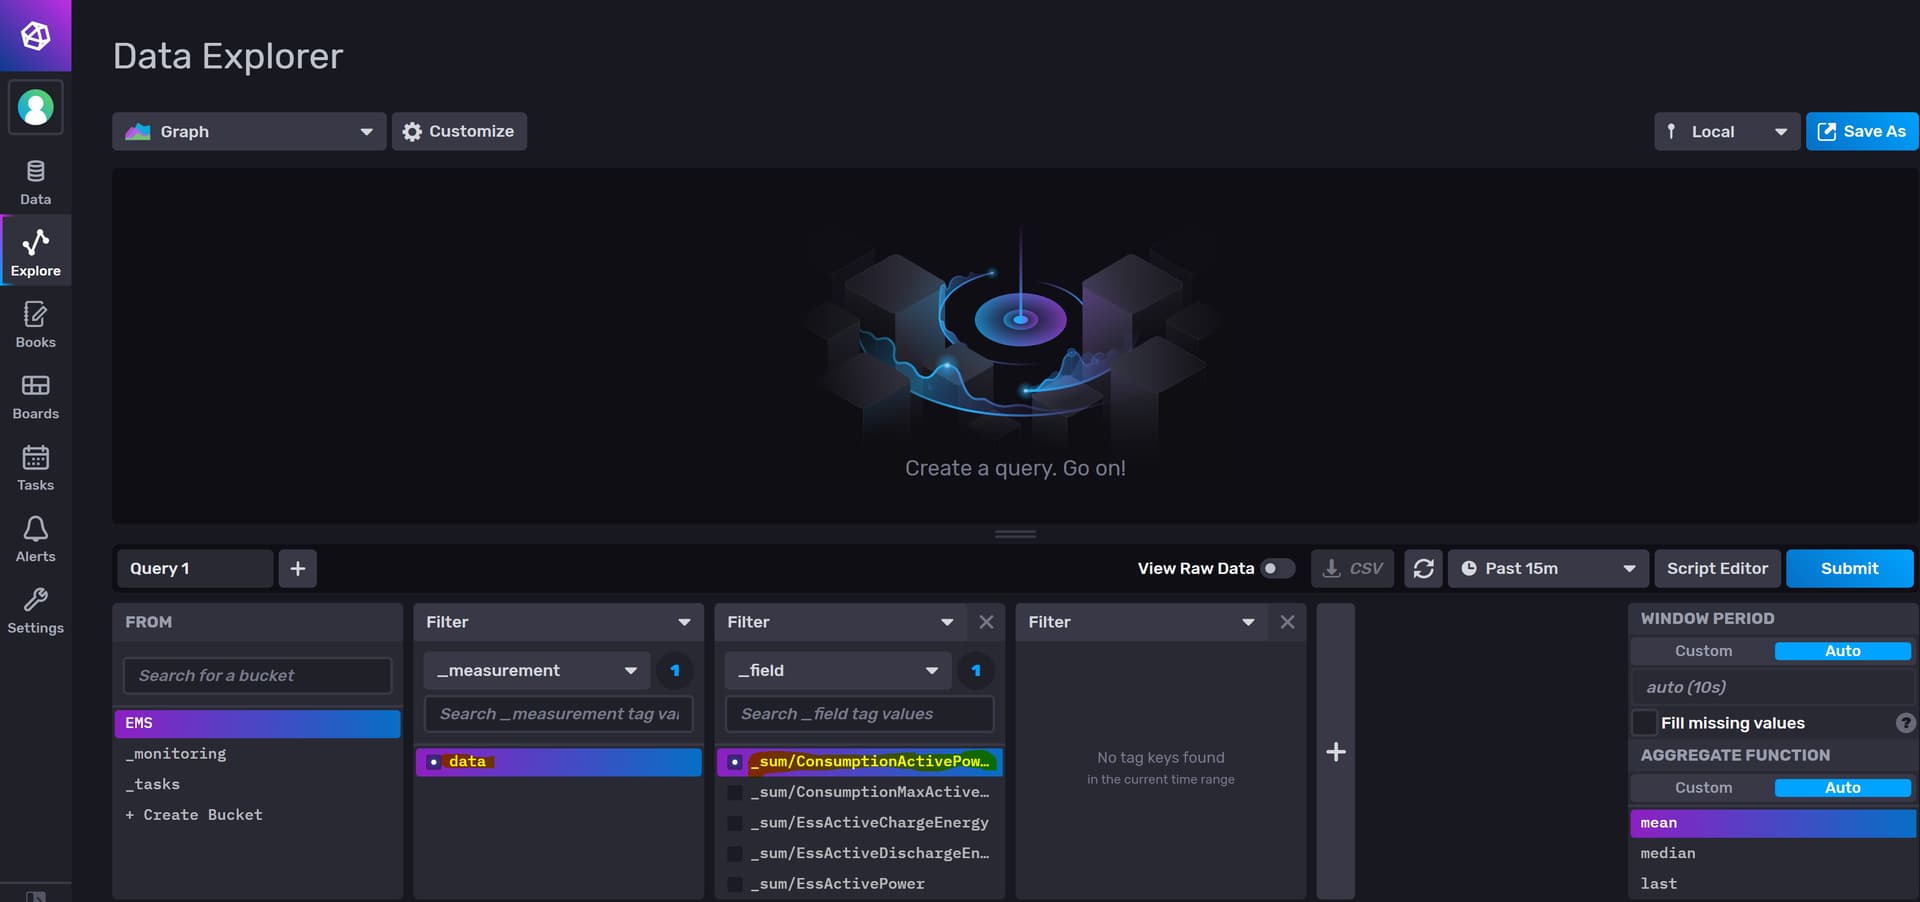
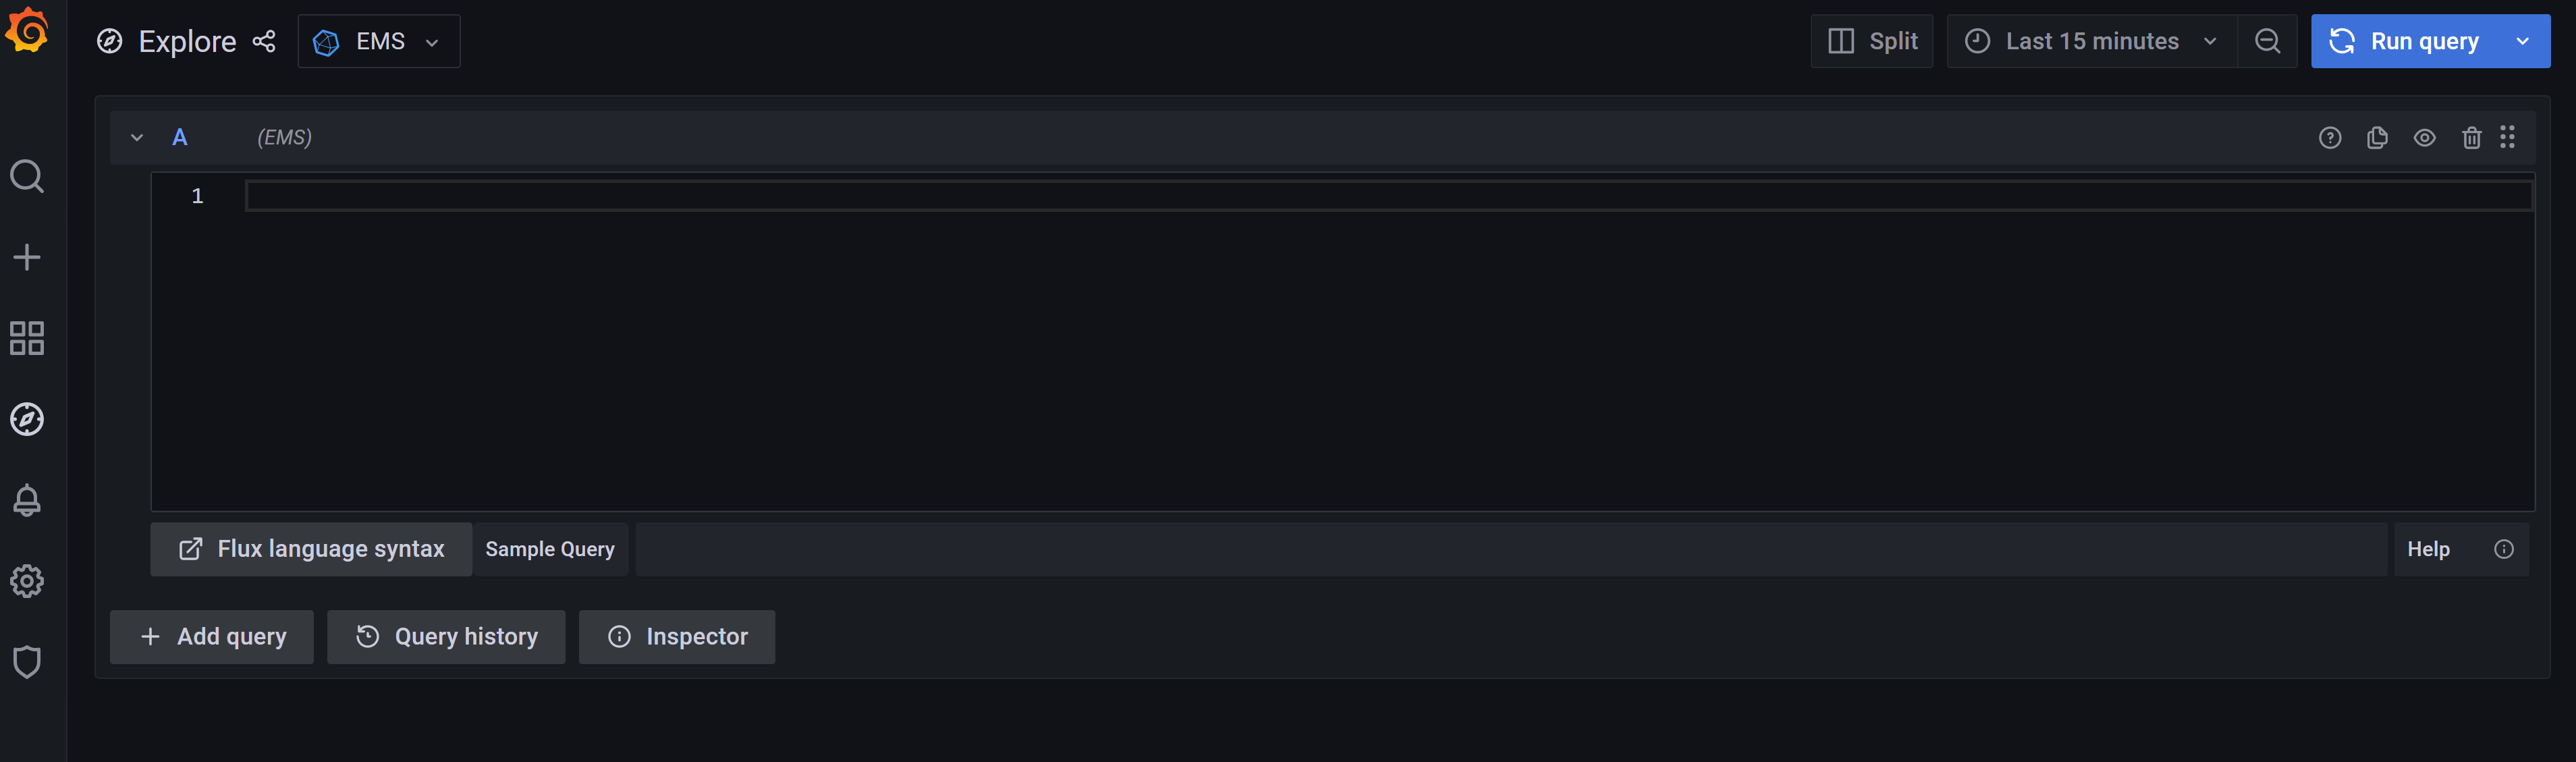
Hi @simonfey …Thank you very much … I started receiving “Data” from OpenEMS as shown in the below figure. However, I am not able to see the simulation values … So I tried to connect the InfluxDB to Grafana to visualize the results but i am not able to reach to the data… is there any advise to get it ?
Hi @Abdallah afaik there needs to be data in your influxdb when these channels/filters show up. So I guess you are pretty close. You can double check on:
Did you properly “Submit” the query?
Did you select a time window that actually contains data? (Past 15 minutes)
Does other data get stored except _sum/ConsumptionXXX?
You can also put a debug breakpoint in InfluxConnector:java:515 in order to make sure that your Edge or Backend is actually writing points to your influxdb.
habe leider das Problem, dass bei meiner InfluxDB keine historischen Daten ans openEMS UI Edge zurückübertragen werden. Die Grafik zeigt keine Daten an. Im Log der InfluxDB steht folgendes: